China's rise in science has a ceiling, and it was born in 2016
75 years of materials research, country by country: post-war dominance, a rebuild, a 4,700 km shift east, and the birth rate that will decide what comes next.
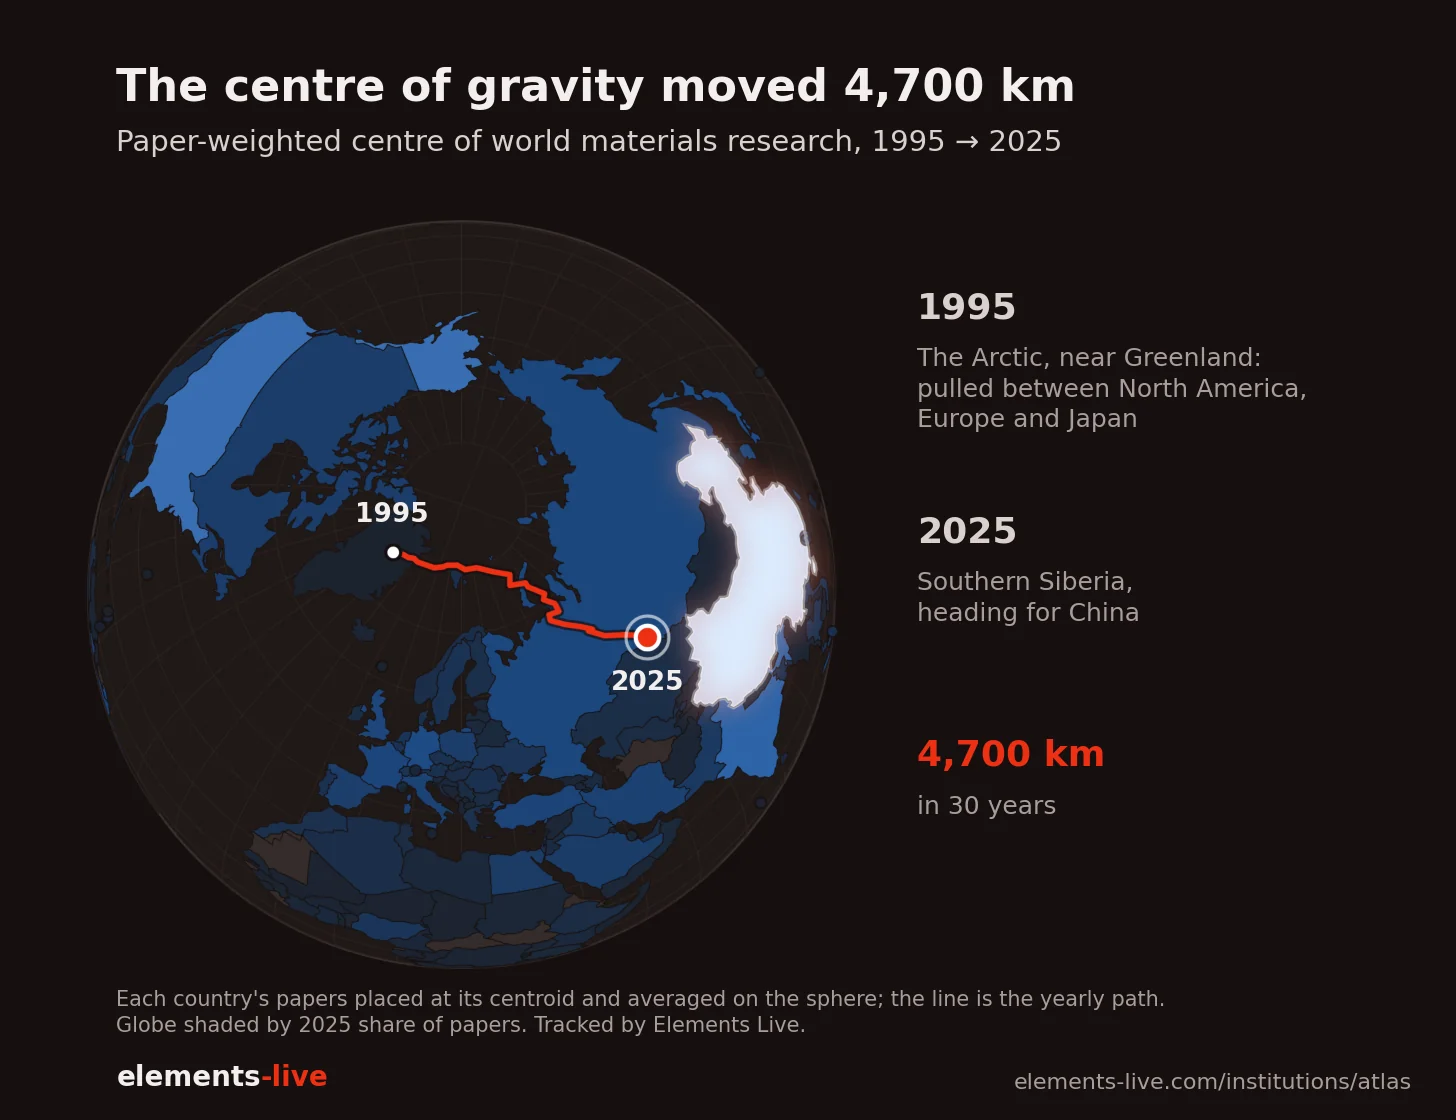
Put every paper on the globe at the country that wrote it and average the positions: that's the centre of gravity of the world's materials research. In 1995 it sat in the Arctic near Greenland, pulled between North America, Europe and Japan. By 2025 it had moved 4,700 km east, across the Arctic, into Siberia, heading for the Himalayas.
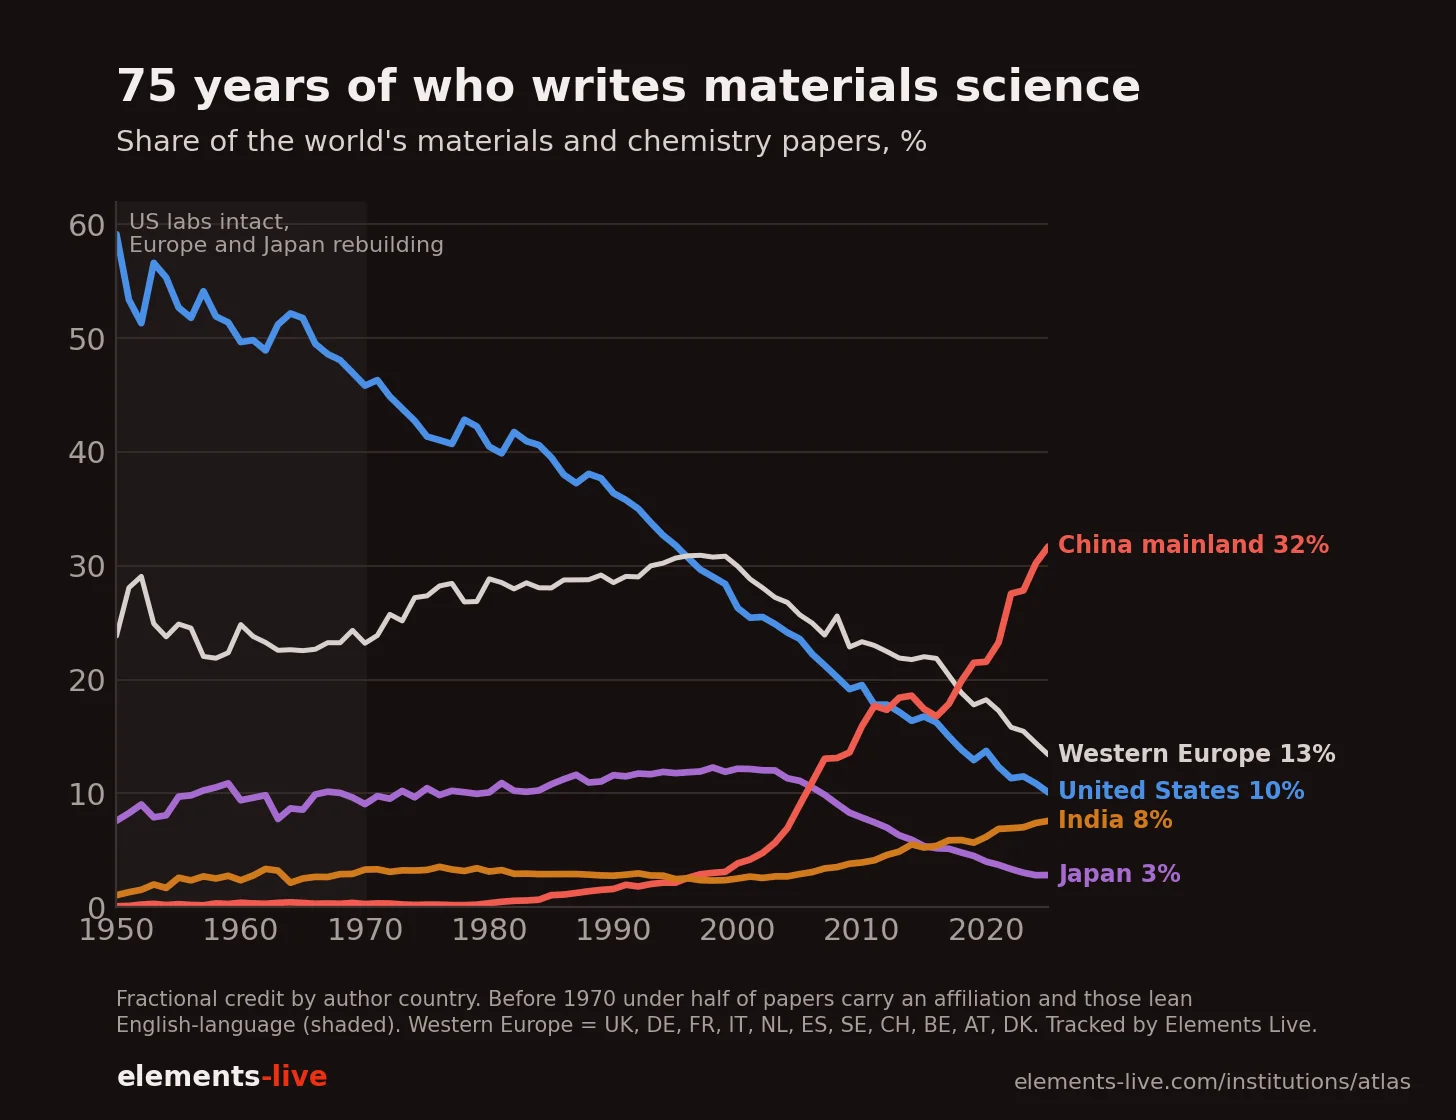
In 1950, American labs wrote more than half of the world's materials and chemistry research vs. 10% today. Most people would confidently state that China took this share, but a big part of the share decline already happened by the 90s before China could make its mark. As late as 1995, China mainland still only wrote 2% of the world's papers, while the US share had already fallen from 59% to 32%. This means more than half of America's decline came before China was in the picture.
What happened first was the rest of the world rebuilding systematically on the back of targeted subsidies like the Marshall Plan. What's happening now is China reaping the fruits of its rapid industrialization and urbanization. And what happens next, I'll argue, is already written in the birth records, partly a side effect of the same.
1950: Last Man Standing
At the end of the war, the United States was the only major scientific power with its labs, universities and factories intact. Add to that a fresh infusion of top-tier scientific talent from abroad during and after the war and the deck was stacked in its favor. Beyond a federal research budget the rest of the world couldn't match, it also doubled down by building institutions like the National Science Foundation in 1950 and programs like the GI Bill that put a generation through university.
The raw quantity of papers shows it: in 1950 the US wrote 59% of the papers we can place, the UK 13%, Japan 8% and West Germany 5%. France wrote less than 2%. Records from this era undoubtedly carry an English-language bias and patchy attribution, but the direction itself isn't in doubt.
1960–1995: The Rebuild
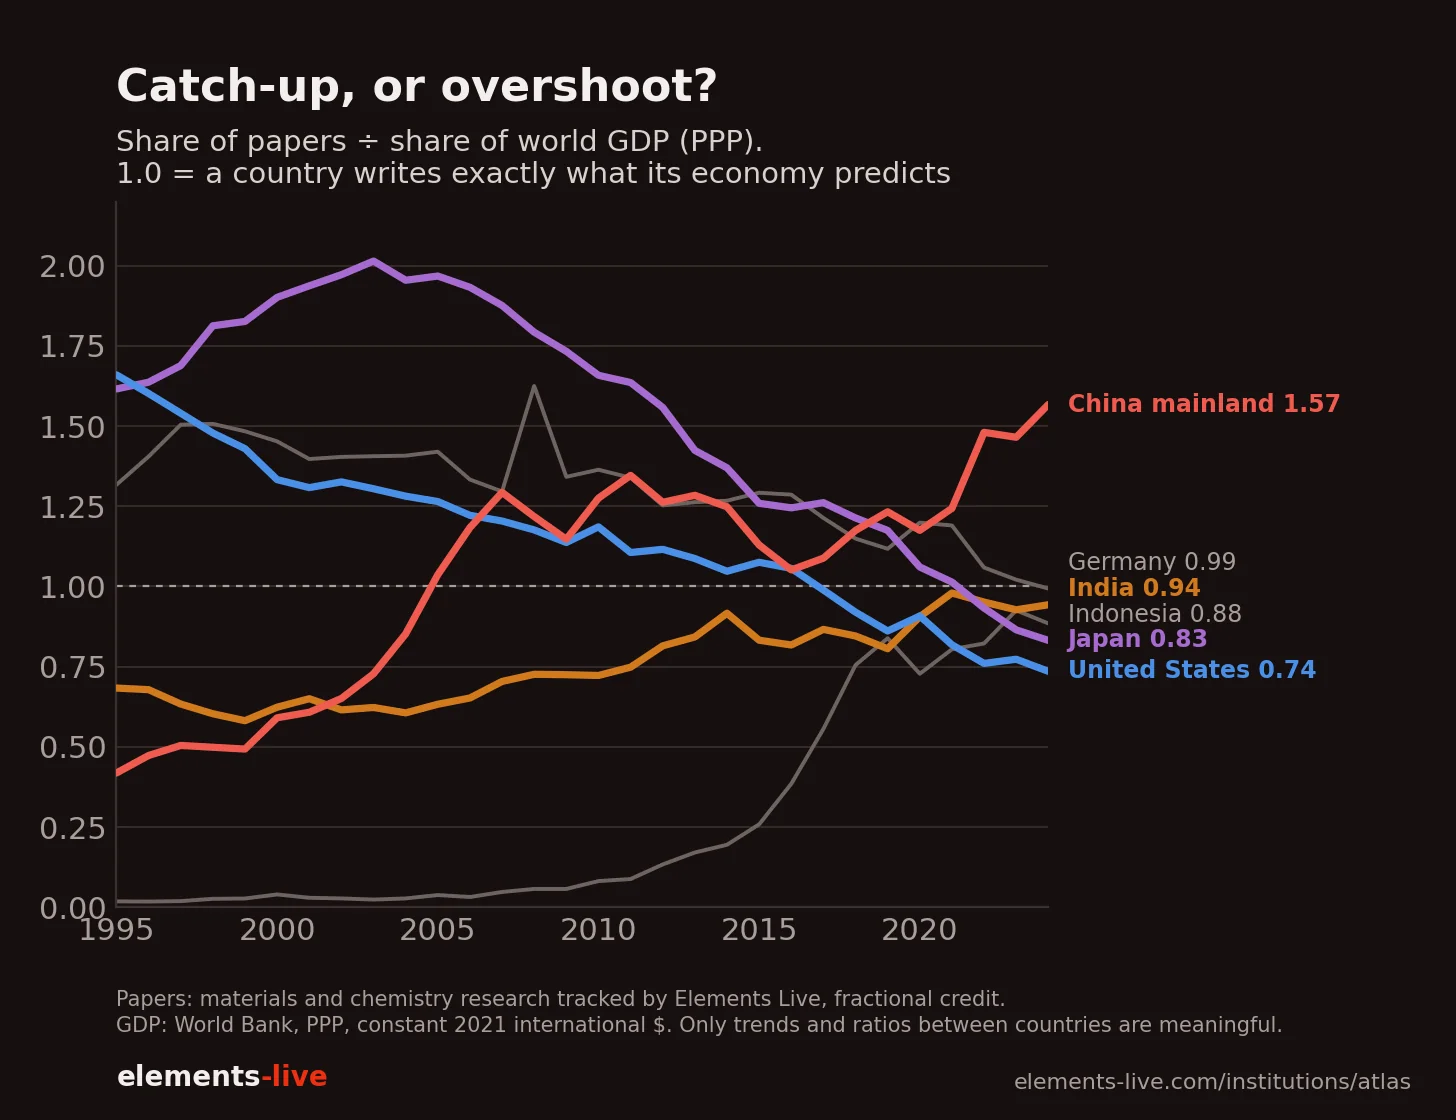
Europe and Japan rebuilt their economies first, then their scientific output followed a generation behind. Dividing each country's share of the world's papers by its share of world GDP shows this exact sequence. At 1.0, a country writes about as much research as its economy predicts.
By 1960 West Germany's economy had already recovered, but its science sat at 0.56 and France's at 0.67: both wrote barely half to two-thirds of what their economies could support. Germany's science caught up with its economy by 1980, and France's by 1990.
In aggregate, Western Europe went from about a quarter of the world's papers in the 1950s to 31% by the mid-1990s. Japan rose from 8% in 1950 to 12% by the mid-1990s, second in the world. The US share kept falling as everyone else rebuilt: 46% in 1970, 36% in 1990, 32% in 1995.
None of that was American failure. It was the world returning to normal after an abnormal moment, and once Europe's science matched its economy, it stopped climbing.
1995–2025: Asia
Western stagnation coincided with a reshuffling in Asia's order. China mainland passed the United States in 2013. In 2015 the two were level, 17.4% and 16.8%. In 2025 it's 31.7% and 10.1%. India passed Germany in 2013 and Japan in 2016, and now writes 7.6%, third in the world. Japan, second in 1995, now writes just 2.8%.
On purchasing-power GDP, China reached 1.0 by 2005 and kept going, to 1.57 in 2024. The US is at 0.74, Japan 0.83, Germany 0.99, India 0.94.
Quantity AND Quality
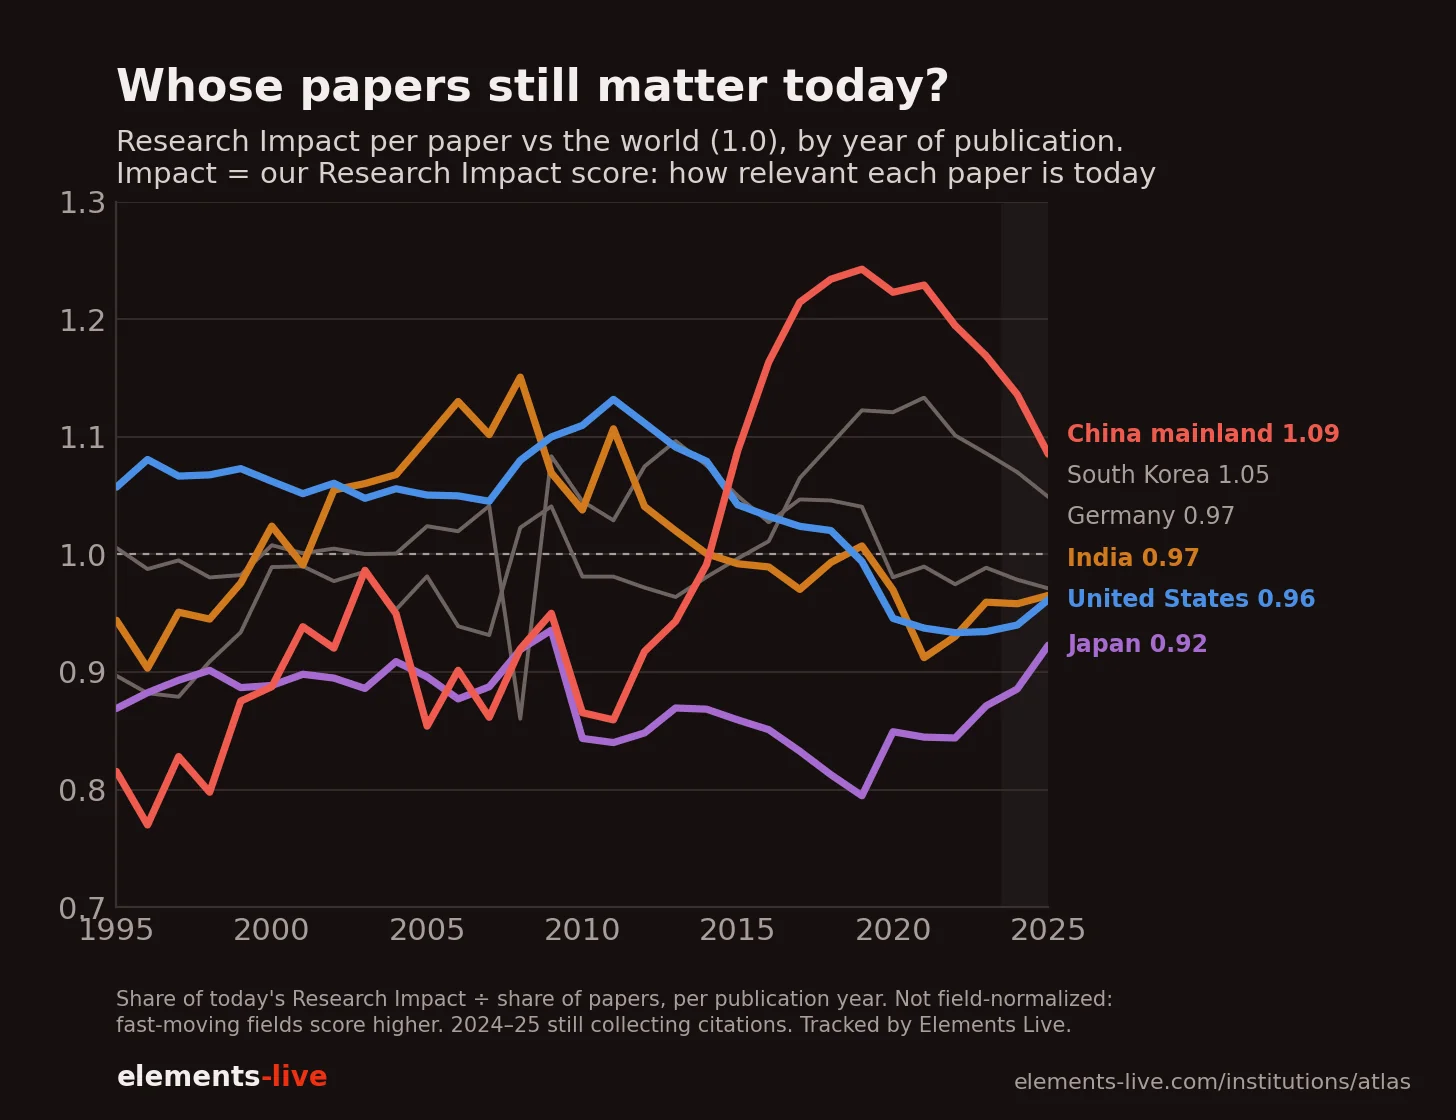
China's papers didn't just multiply, they got better, and the turn came in 2015. Our Research Impact score measures how relevant each paper is today, however old it is, so dividing a country's share of today's impact by its share of papers, publication year by publication year, gives its impact per paper against the world, where anything above 1.0 means its papers matter more than their numbers alone would suggest.
For twenty years American papers punched above their weight, with every publication year from 1995 to 2018 carrying 2–13% more impact per paper than the world's, while Chinese papers sat below at 0.77 to 0.95. The two crossed in 2015, and Chinese papers from 2019 now carry 24% more impact per paper than the world's while American papers from 2019 on carry 1–7% less. Summed over every paper ever written, China mainland holds 27.4% of the world's research impact today against 13.2% for the US, which leaves the US at 0.48 of the leader.
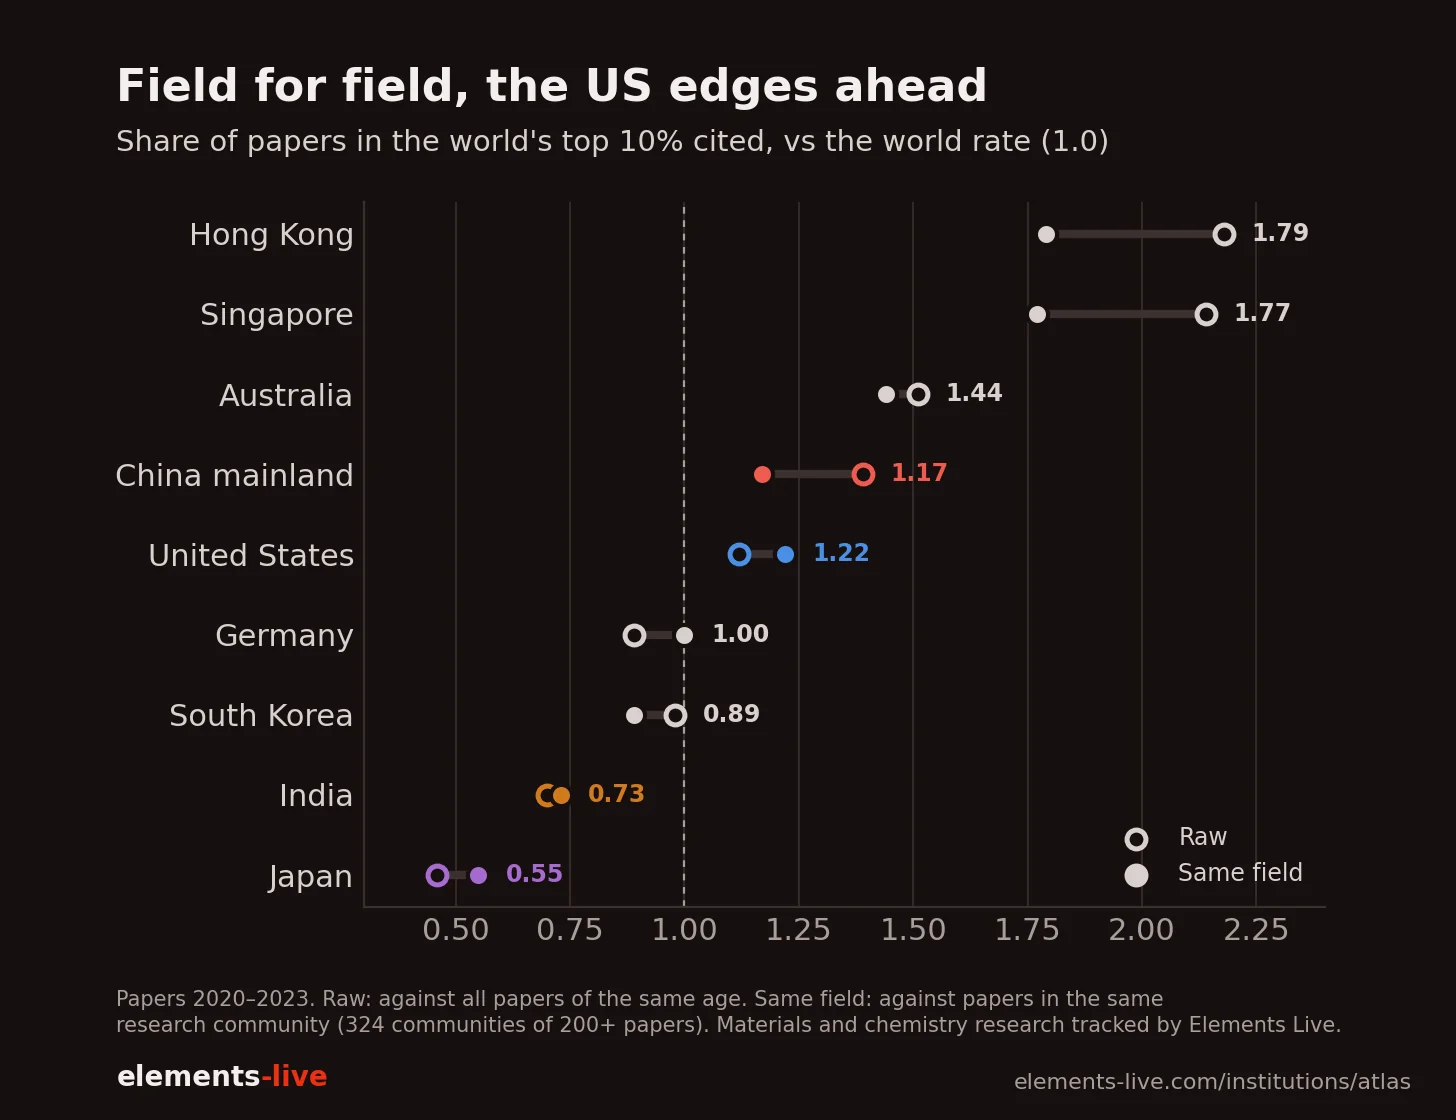
That comparison does flatter China, because our impact score isn't field-normalized and China publishes most in fast-moving fields like catalysis, energy and electronic materials, where it often writes more than half of the papers. Comparing papers only against others in the same field (papers from 2020–2023), China mainland's papers reach the world's top 10% most cited at 1.17× the world rate and the US at 1.22×, so about half of China's citation lead disappears. Japan (0.55×) and India (0.73×) sit below the world even within their own fields, while the average American paper still holds its own; there are just far fewer of them.
America's Turn Inward
In 2000, Chinese materials papers cited other Chinese papers seven times more often than China's weight in each field would predict, while American papers cited American work 1.4 times more often than expected. The lines crossed in 2018, and by 2024 the US stood at 1.84× against China mainland's 1.37×, so relative to its weight, America now cites itself more than China does.
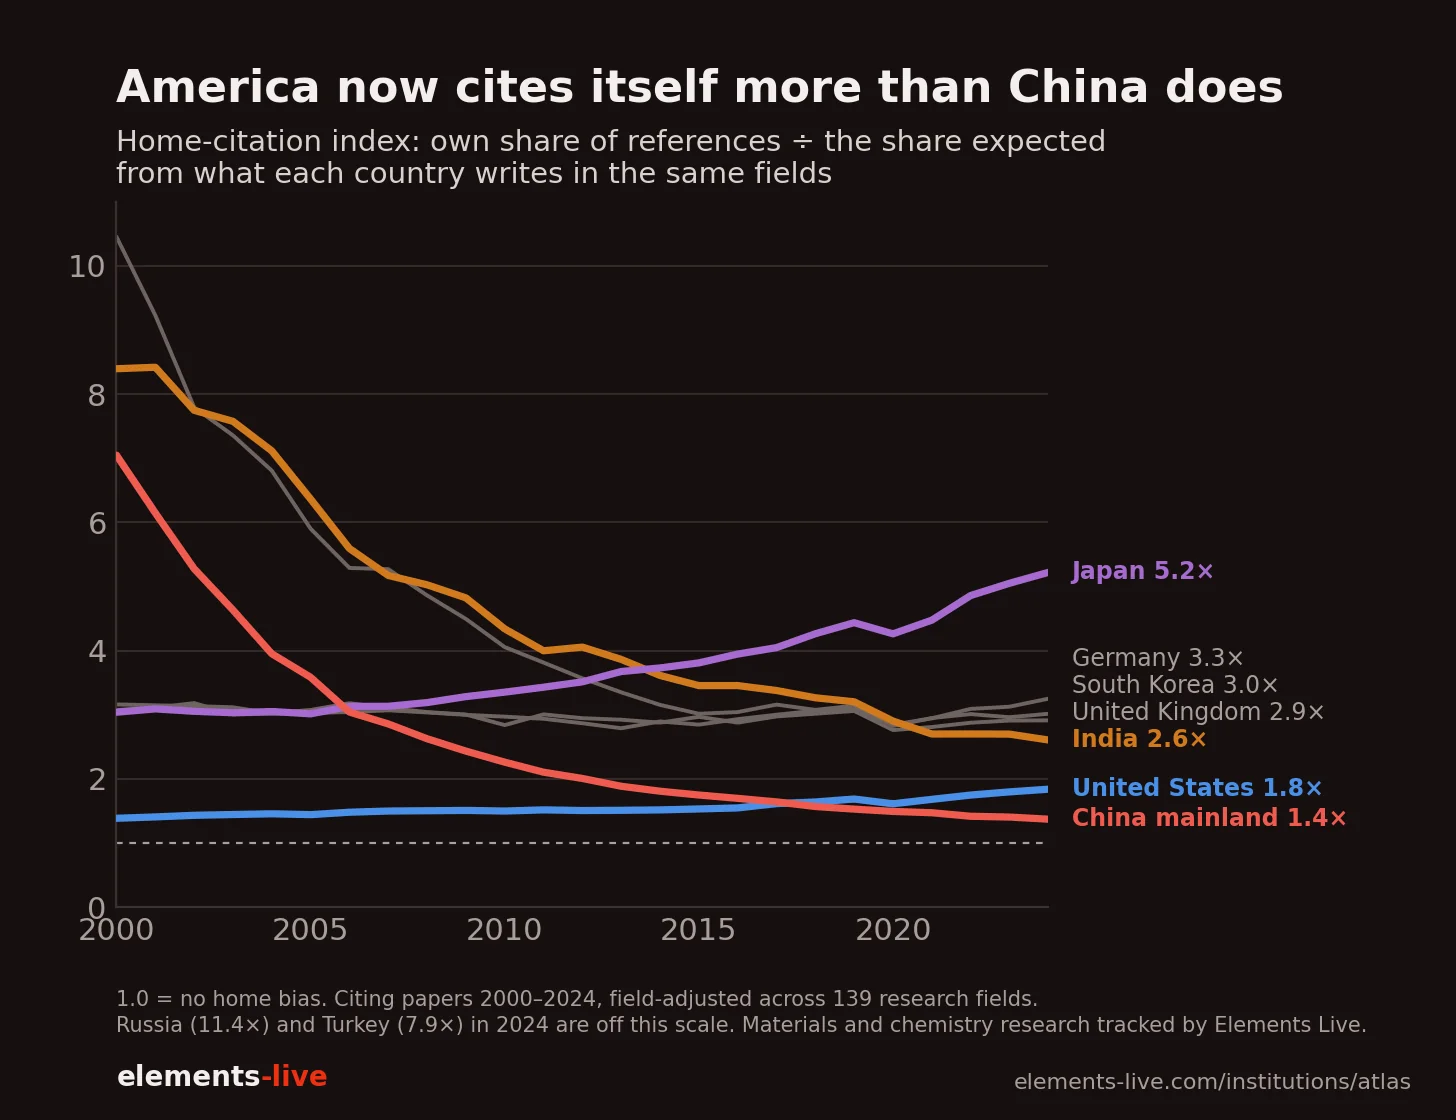
The US isn't the most inward-looking country, with Russia at 11.4×, Turkey at 7.9× and Japan having climbed from 3.0× to 5.2×, but it is moving the wrong way while the country it worries about most moves the other. Its research mix is drifting the same way, further each year from what the rest of the world works on, while China mainland's converges on the world's, partly because it increasingly is the world's.
Root Cause Analysis
To see why China overshot when Europe and Japan settled at their economic weight, we checked the obvious suspects against the 17 largest producers, scoring each country's share of papers against its share of each input, where 1.0 means it writes its fair share.
What doesn't explain it:
- GDP: China mainland is at 1.57, writing far more than its economy predicts.
- Population and working-age population: 0.84 and 0.82, so on people alone China should write more still, while the US, at 2.3, should write far less.
- University enrolment: 0.89, closer, but the US sits at 1.41 and Germany at 2.53.
- R&D spending: China mainland 1.04 and the US 0.55, since American R&D is mostly corporate and goes to medicine and software rather than materials papers.
- Advanced degrees: the international data barely covers China and India, so we couldn't test it.
The key metric turns out to be the simplest: the raw number of researchers. Controlling for that, China mainland writes exactly its share, 0.99 in 2020, up from 0.28 in 2000, in line with the US and Germany at 0.94 and the UK at 1.17. The big producers have converged on the same output per researcher, and China's climb from 0.28 likely reflects labs and methods modernizing to close that gap. Its overshoot against GDP isn't extra output per head, the signature paper mills would leave, but a research workforce bigger than its economy. The exceptions prove the rule: Japan and South Korea score 0.61 because their researchers mostly work in industry, where the output is patents rather than papers.
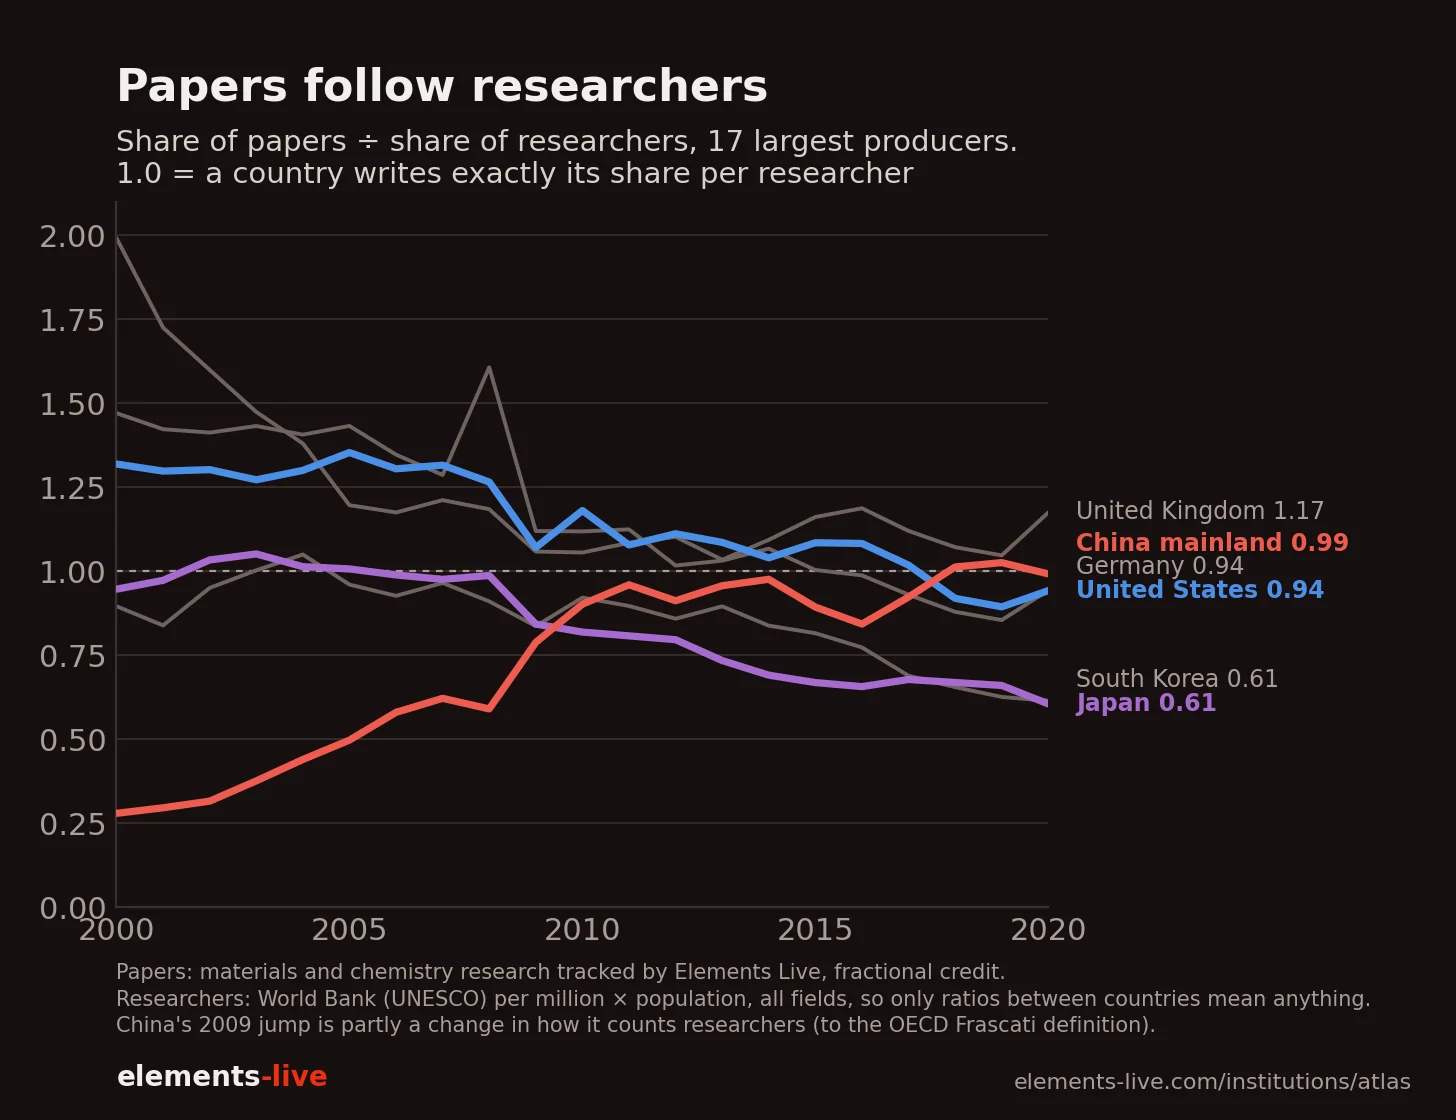
Yu Xie and colleagues made this argument in PNAS in 2014, that China's rise in science rests on its people, and ten years on the per-researcher numbers back them. If papers follow researchers, then the question about the future becomes a question about people.
Demographics IS Destiny
China's formula is built on a familiar playbook: industrialize, then encourage the young to enrol in university en masse. Tertiary enrolment rose from 5% of the age group in 1995 to 75% in 2023, above Japan (64%) and about level with the US. The distinction is that no state has ever run this play with the leverage of well over a billion people.
However, the play is running out of players. In 2016, the first year of the two-child policy, China had 18.8 million births, its last big cohort, and by 2023 births had halved to 9.0 million. Those children will reach the lab at around 25 to 30, in the 2040s.
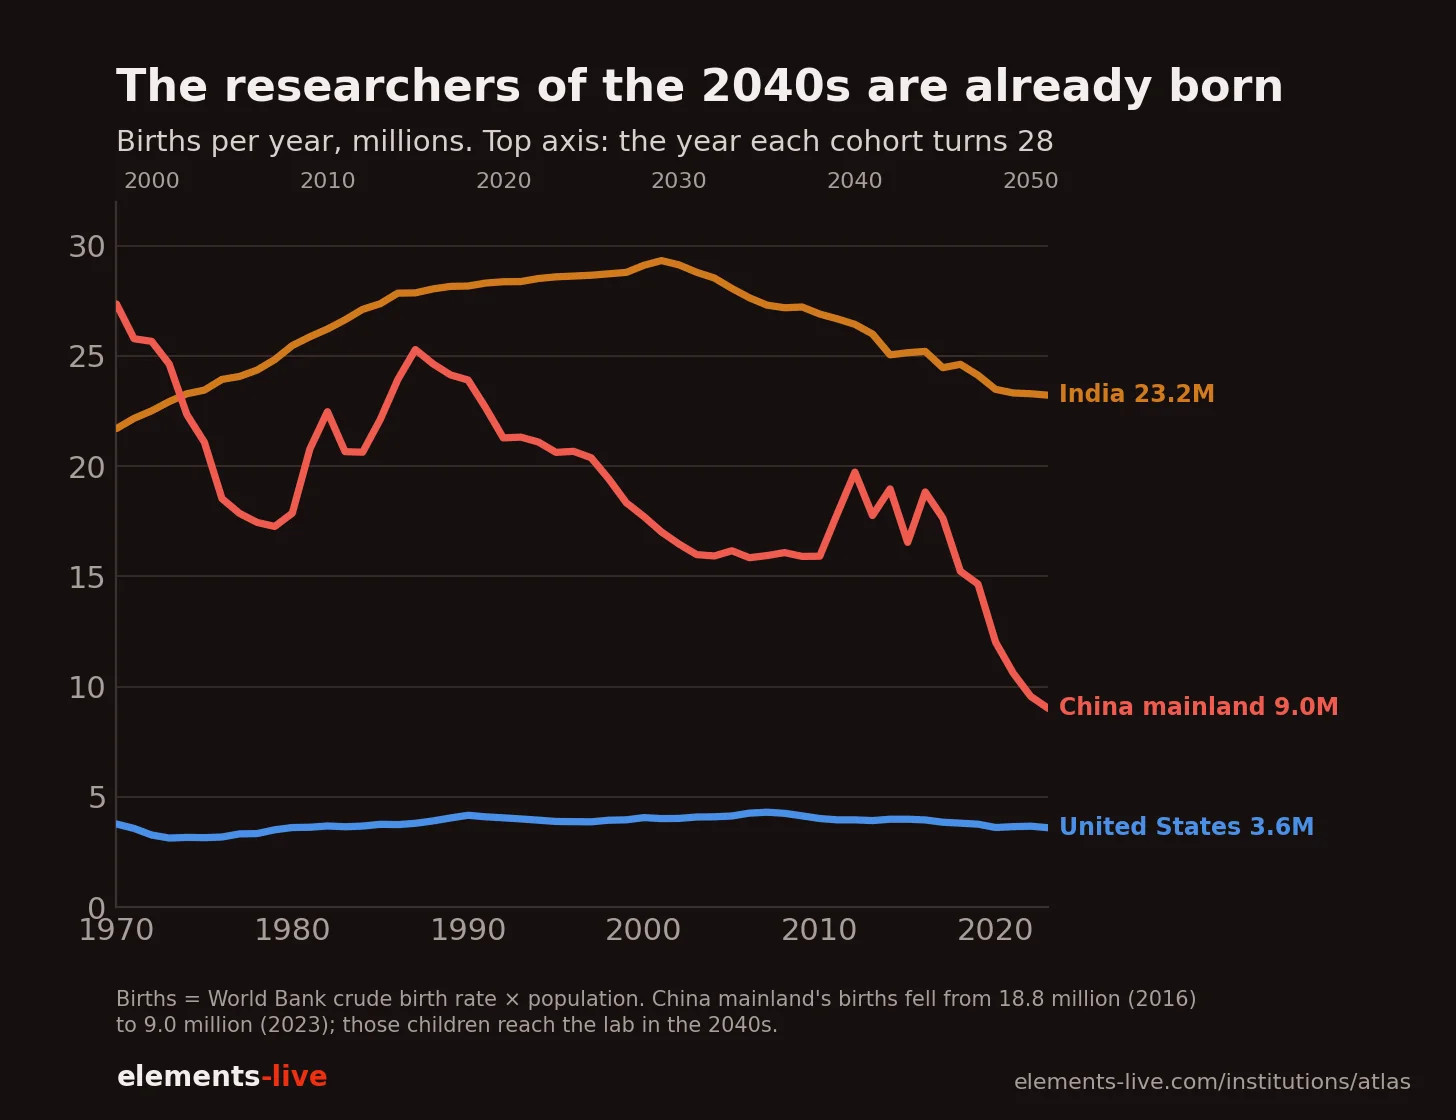
Japan has already run this experiment. Its last big generation, the second baby boom of the early 1970s, reached its late twenties around 2000, and Japan's share of the world's papers peaked in the late 1990s, with its output against GDP peaking in 2003 and falling ever since.
What counts is not just students but also their conversion rate into productive researchers, and it is on this conversion that China still has one card to play. It has the students but turns few of them into researchers: 4.8 for every 100 university students in 2020, against 8 in the US and about 14 in Germany and South Korea. That's where America was in 1975, in the middle of its own university boom and with an economy still built on factories, and as the US moved from factories to labs its rate nearly doubled. With manufacturing still a quarter of China's economy, following the American path would make turning students into researchers its next decade of growth, and that's a change in the economy, not the classroom.
My forecast is that China mainland's share keeps rising for a while, since few of its researchers are retiring (the generation born in the 1960s rarely went to university), but that growth slows in the 2030s as the enrolment play runs out and peaks in the 2040s as the post-2016 cohorts arrive. How high that peak goes depends on how fast China moves from factories to labs.
If demographics turns out to be destiny again, India is the one large producer with both big cohorts (23 million births a year) and room to send more of them to university (34% enrolment), with the potential to take up the mantle as China stabilizes.
The wildcard is AI: if one researcher with good tools writes what three did, the link between people and papers breaks and demographics loses its grip. Whether that's already happening, whether output per researcher changed after 2023, is the subject of a later chapter in this series.
Methodology
- Scope: the materials and chemistry research Elements Live tracks, not all of science.
- Credit: fractional. A paper with authors in three countries gives each a third.
- Affiliations: from OpenAlex. About a third of papers carry them in the 1950s, half by 1970, 63–79% in 1995–2019 and 80–87% since 2020. Before 1995, shares lean towards English-language journals.
- Citations: top-10% is ranked against papers of the same age. Same-field comparisons rank papers from 2020–2023 within their research community (324 communities with 200+ papers).
- Home citation: field-adjusted. Only the ratios are meaningful.
- Inputs: World Bank: GDP (constant US$ before 1995, PPP after), population, working-age population, tertiary enrolment, researchers per million, R&D as % of GDP, births, manufacturing share of GDP. US researcher history: NSF before 1981, OECD after; US enrolment: NCES. Researcher and R&D figures cover all fields, so only comparisons between countries mean anything.
- Centre of gravity: the paper-weighted mean of country positions on the sphere.
Now What?
The atlas is live in beta: countries and continents on a globe or flat map, by share of papers, of the most-cited work, or of research impact, year by year, with Play. Institution pages show each university's own trend, its rank among its peers, and its top research communities. (MIT, for one: its share fell from 0.38% to 0.07% as the world grew around it, but it still ranks 37th of 2,975 universities on research impact.)
If you think a number here is wrong, or my forecast is, tell me where. Those comments make the next version better.