War hurt Yugoslav science less than isolation did
Forty years of materials and chemistry papers from Ljubljana, Zagreb and Belgrade, and what they say about the year Serbia's universities have just had.
On October 25 a list built by Serbia's students won a majority in parliament, and Aleksandar Vučić conceded after fourteen years at the top of Serbian politics. The movement began on university campuses after the newly renovated canopy of Novi Sad's railway station collapsed on 1 November 2024, killing sixteen people. Protesters blamed corruption and negligence, and the case is still in the courts. On the engineering side, the court experts' testimony points to evidence that the renovation did not properly prepare the older structure to carry the loads it added. The movement spent most of 2025 with faculties blockaded and lectures suspended. A quarter century ago, another student movement toppled a Serbian government, and in the seven years that followed the country's share of the world's materials and chemistry papers more than doubled, from about one in every thousand to 2.4. Counting papers is a blunt measure of a country's science, but over forty years it shows plainly what universities lose when a country closes in on itself, and how quickly the output comes back once it opens again.
One Federation's Science
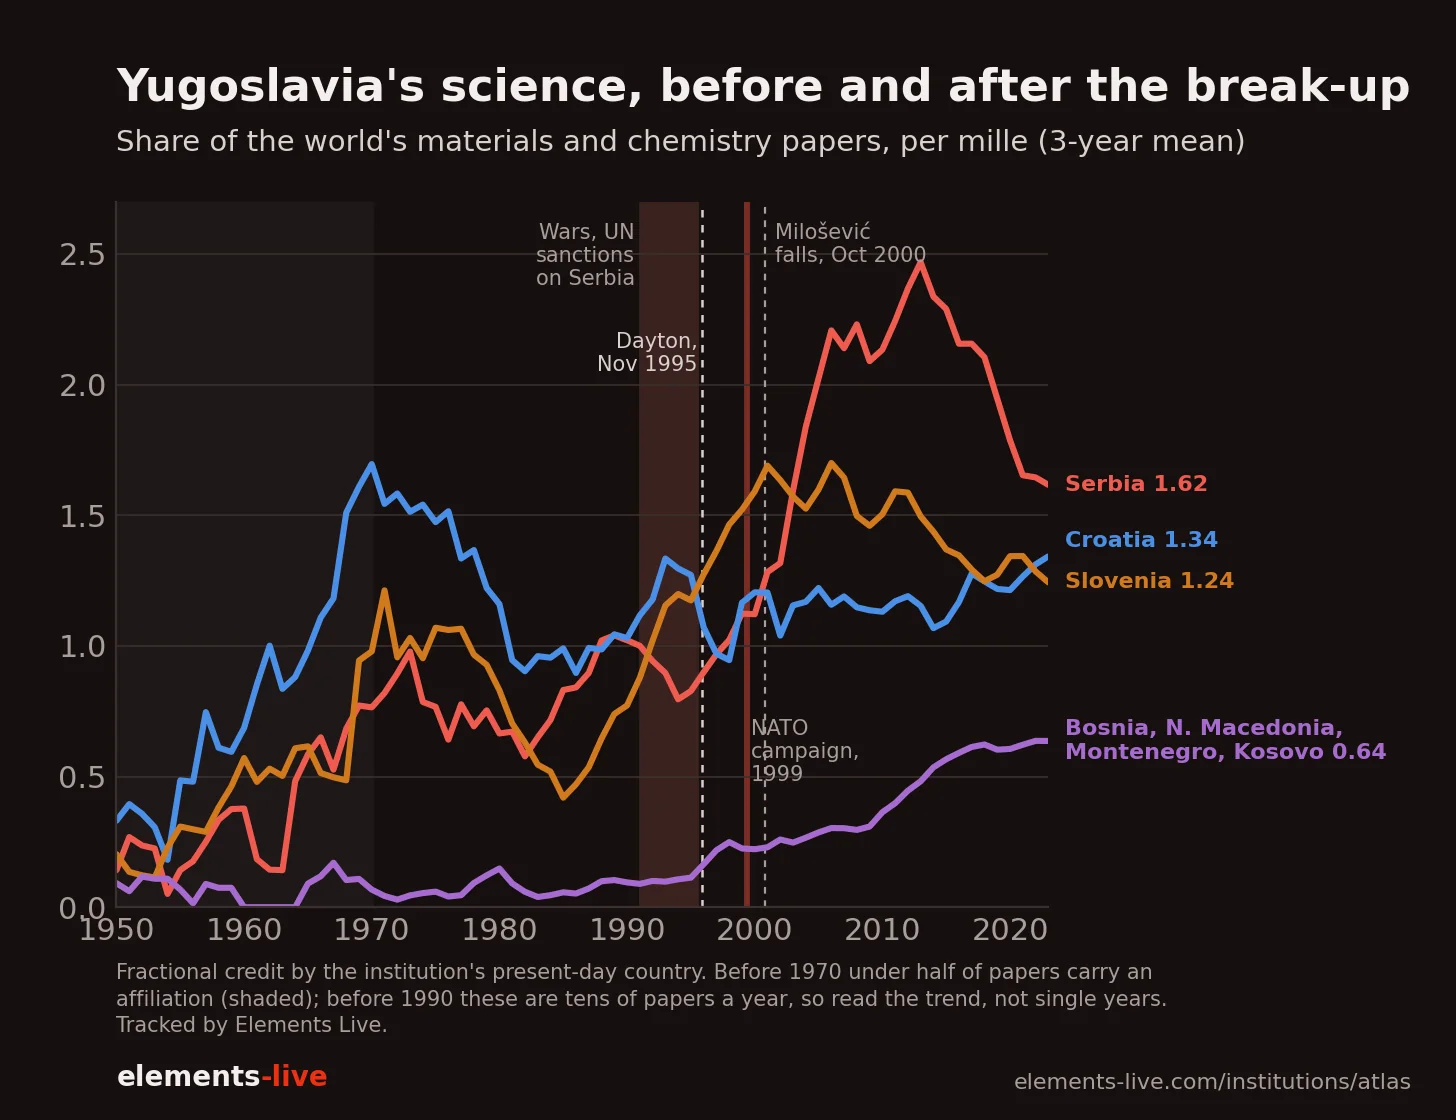
Yugoslavia's science followed the same post-war arc as the rest of Europe, only on a smaller scale. In the 1950s the federation wrote about one in every thousand of the world's materials and chemistry papers that we can place, and by the 1970s it wrote 3.4, with Croatia the largest producer of the republics until 1990.
The Bridge Years
The story told about those decades is that Yugoslavia prospered as the bridge between East and West, with Western credit, open borders and a foot in both camps. Against southern Europe the papers bear that out. In the early 1970s Yugoslavia wrote twice as many materials and chemistry papers as Spain, a country with two-thirds more people, and four times as many as Greece, at a time when both were still dictatorships.
Against the Eastern bloc the papers don't bear it out at all. Per head of population, Yugoslavia wrote about two-thirds of the world average in the early 1970s, level with Poland but a third of Czechoslovakia's rate and half of Hungary's and Bulgaria's. Its papers didn't punch above their weight either: measured by our research impact score against papers from the same year, Yugoslav work sat at 0.82–0.88 of the world average through the 1970s, the same band as Czechoslovak, Polish and Hungarian work. That comparison is if anything generous to Yugoslavia, because our records lean towards Western journals, where Yugoslav scientists published far more readily than their colleagues in the Warsaw Pact, who wrote much of their work in Russian and in domestic journals. The same lean leaves us a slight blind spot in the other direction, though, since the work Yugoslav scientists published together with colleagues in the Eastern bloc, often in its journals, is thin in our records as well, so we can't say how much of the federation's science faced east.
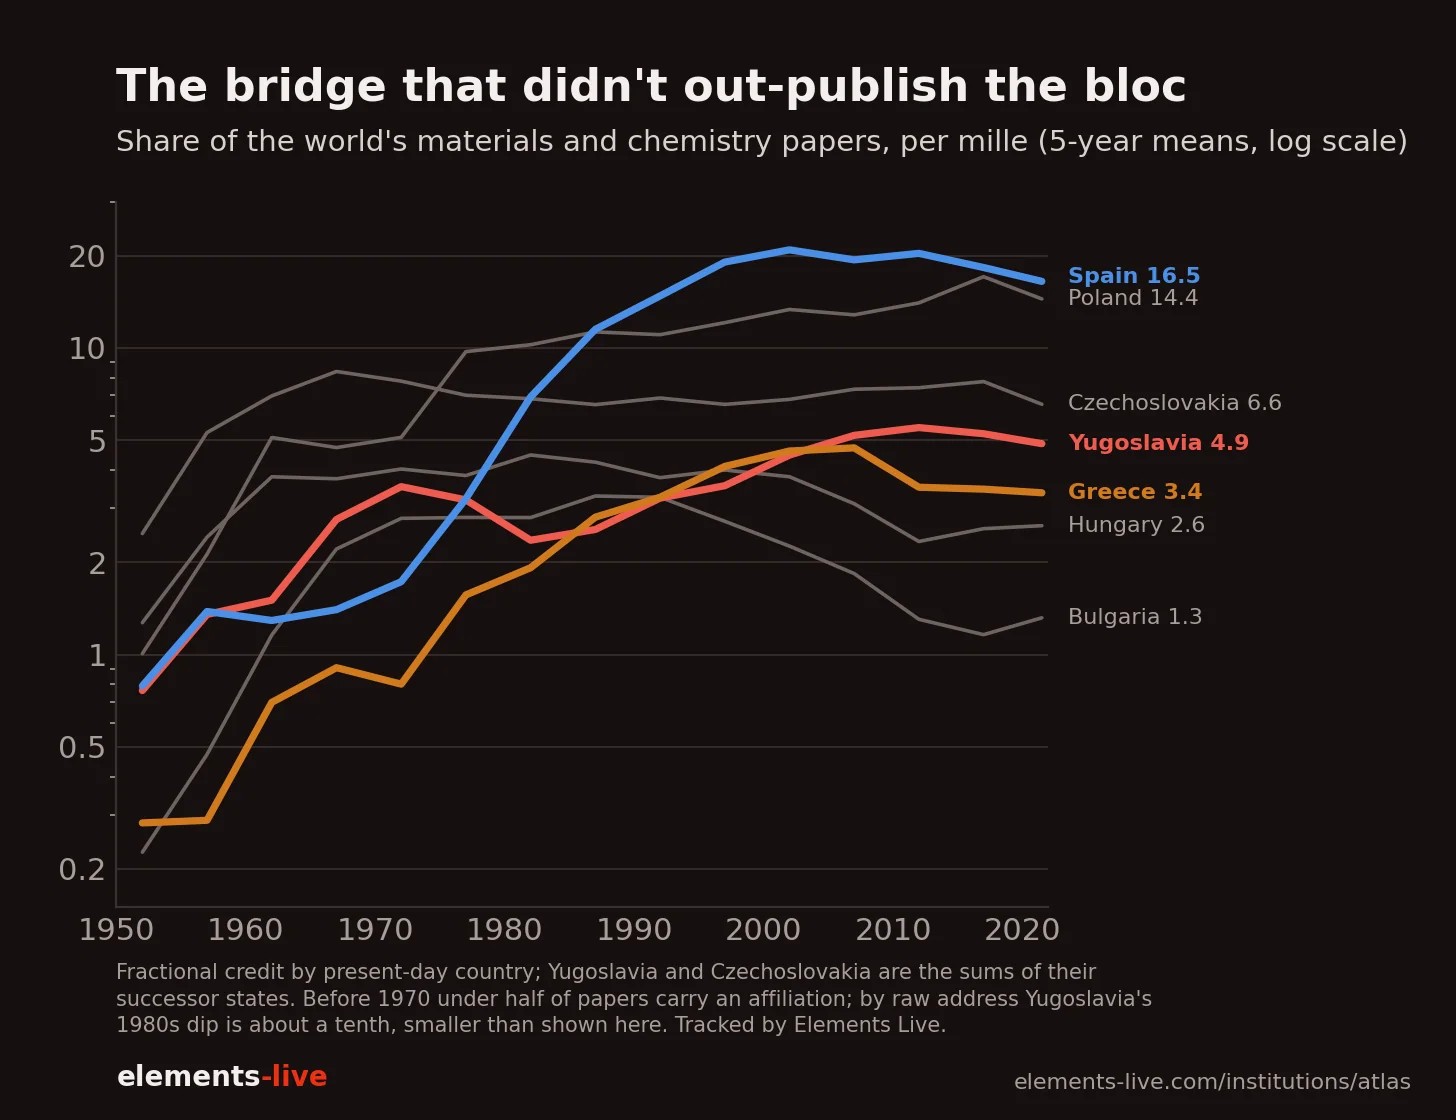
What the bridge years did produce was a fast climb, from under one paper in a thousand in the early 1950s to over three by the 1970s, and then a stall. Counting papers by the country in the authors' addresses, Yugoslavia's share peaked in the late 1970s and slipped by about a tenth through the 1980s, while Budapest and Warsaw kept growing; Ljubljana's share fell by about a quarter. The timing matches the foreign-debt crisis and the austerity that followed after 1979, which makes it a mild early version of the pattern the sanctions would show a decade later, an economic squeeze slowing science with no war anywhere in sight. By 1990 Spain and Greece, democracies inside the European Community by then, had passed Yugoslavia per head.
The republics did not do the same science. In the 1980s Belgrade was known for electrochemistry, and electrocatalysis and fuel cells made up about a tenth of Serbia's papers; Zagreb led on trace-element analysis and heavy-metal toxicology, which together made up a quarter of Croatia's; Slovenia's strengths were catalysis, organic synthesis and computational chemistry. It was a division of labour inside one country, and it is worth remembering for what happened to it later.
The Break-Up Didn't Shrink the Region
The region as a whole came through the 1990s larger, not smaller. Its share of the world's papers was 2.9 per mille in 1990 and 3.5 in 1994, in the middle of the wars, because Slovenia's rise more than made up for Serbia's fall. That alone says the decade did not simply knock the region's science down, so the interesting question is where it went down and where it went up.
The smaller republics are harder to read, because the data's resolution runs out below a few dozen papers a year. Macedonia, which left by referendum in 1991 without a war, is just large enough to see, and it follows Slovenia's pattern, its share of the world's papers rising about fivefold through the 1990s, from about two papers a year to about twelve, with no visible dip during the armed conflict of 2001. Bosnia's war years leave a record of one to three papers a year, too thin to set beside the cities, and Montenegro's referendum in 2006 and Kosovo's declaration of independence in 2008 came when each published only a handful of papers a year, so whatever they changed is below what the data can resolve. Papers are also credited to today's countries throughout, so a 1990 paper from Podgorica already counts as Montenegrin, and a new border shows in the data only if the output on one side of it changes.
Ranking the Cities by the Fighting
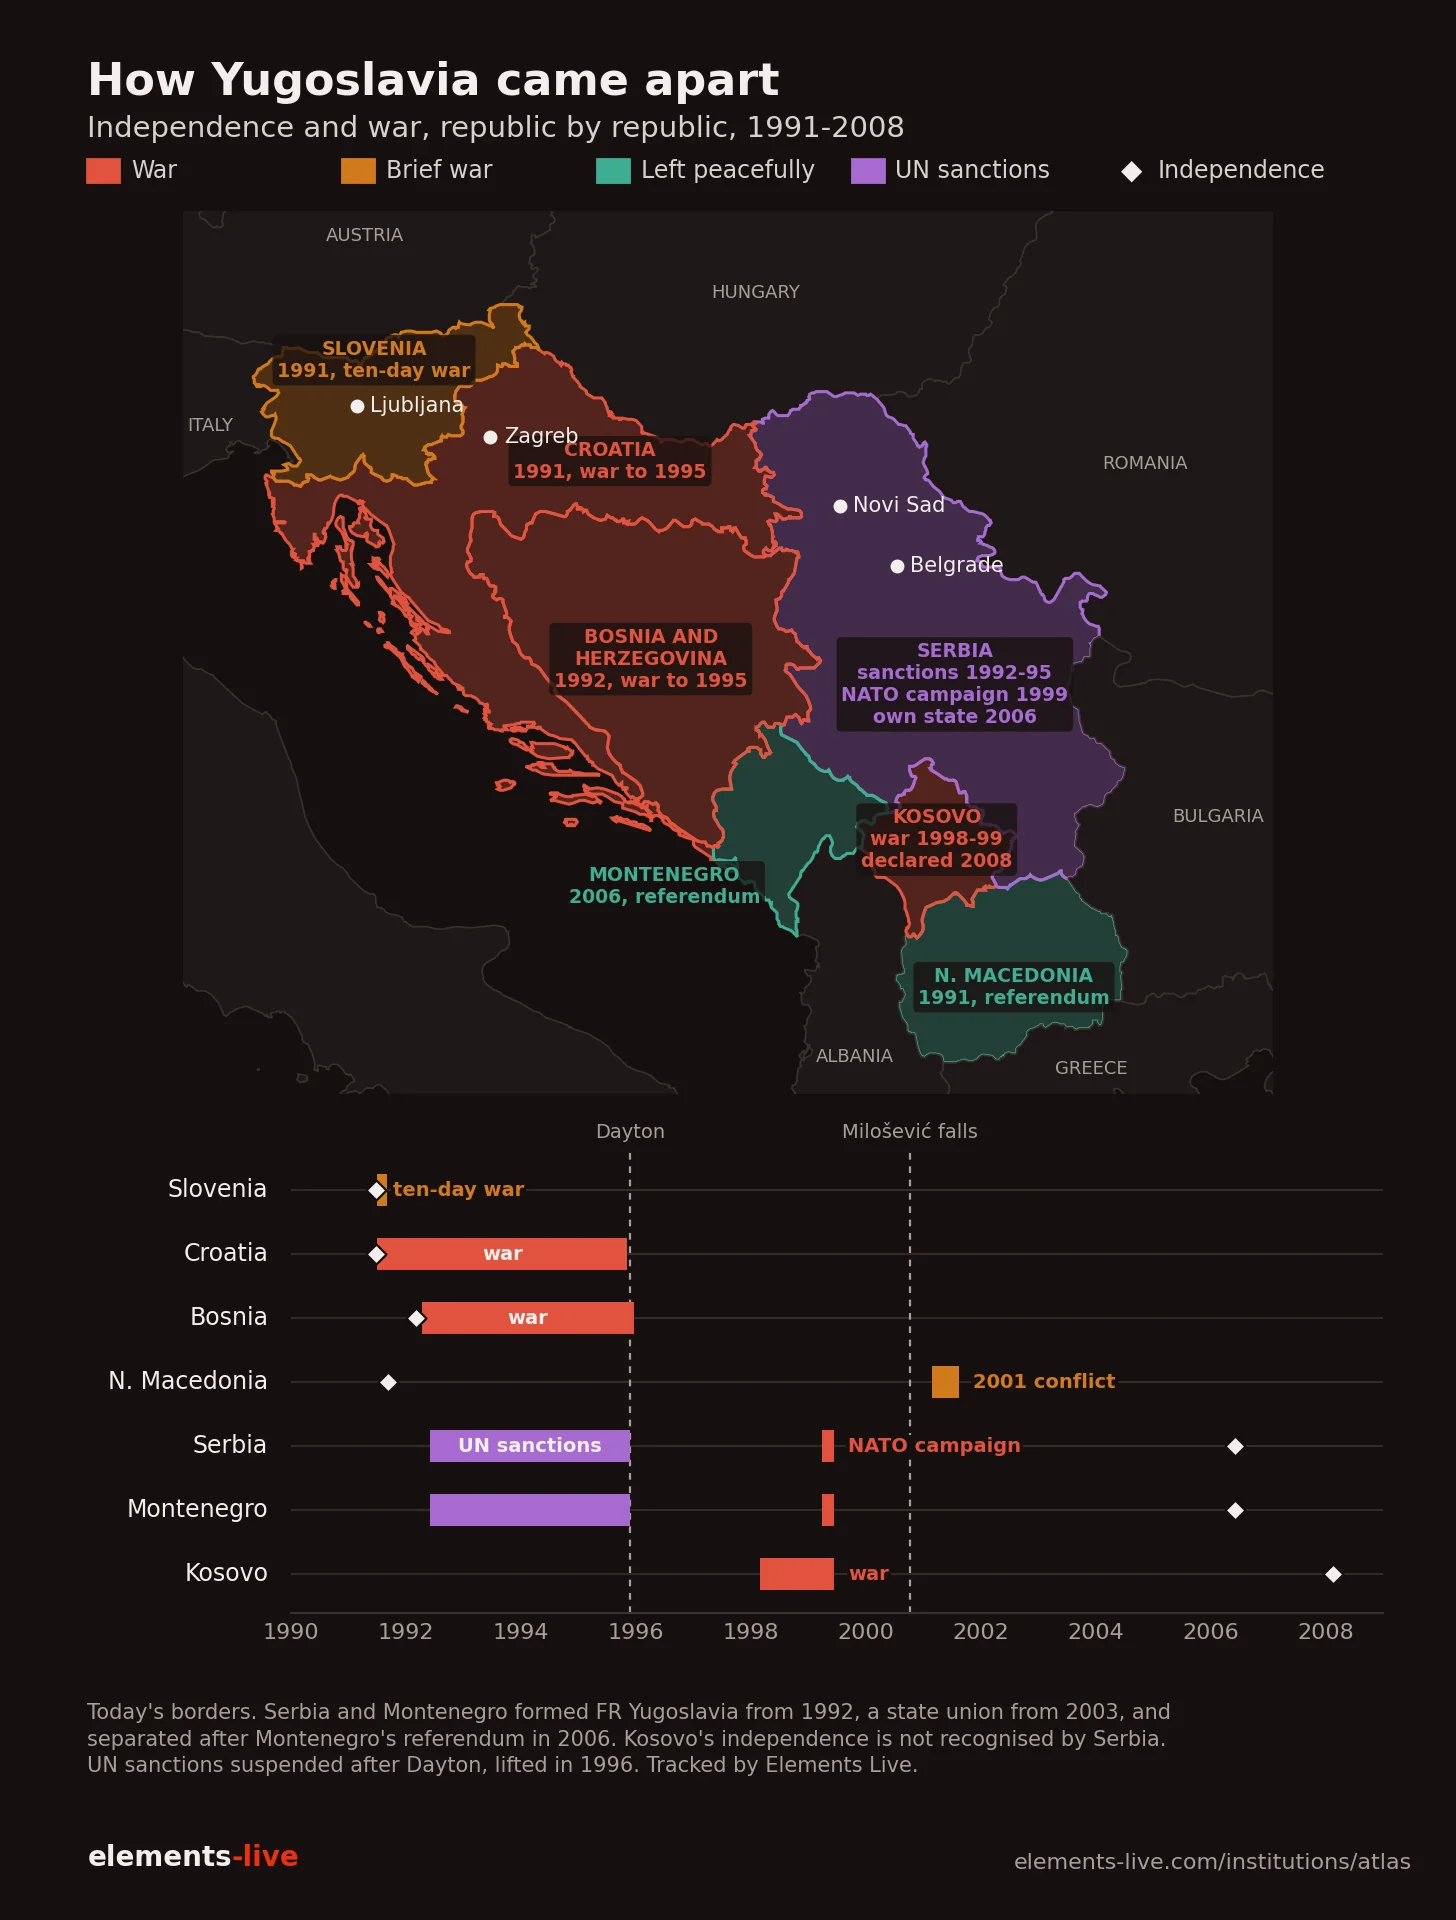
The three capitals make a natural test because each republic left Yugoslavia in a different way. Slovenia's war lasted ten days in the summer of 1991. Croatia fought from 1991 to 1995, and Zagreb itself came under rocket fire. Serbia fought outside its own borders, but from May 1992 it was under UN sanctions that cut it off from trade, travel and much of the world's scientific life, and in 1993 it went through one of the worst hyperinflations on record.
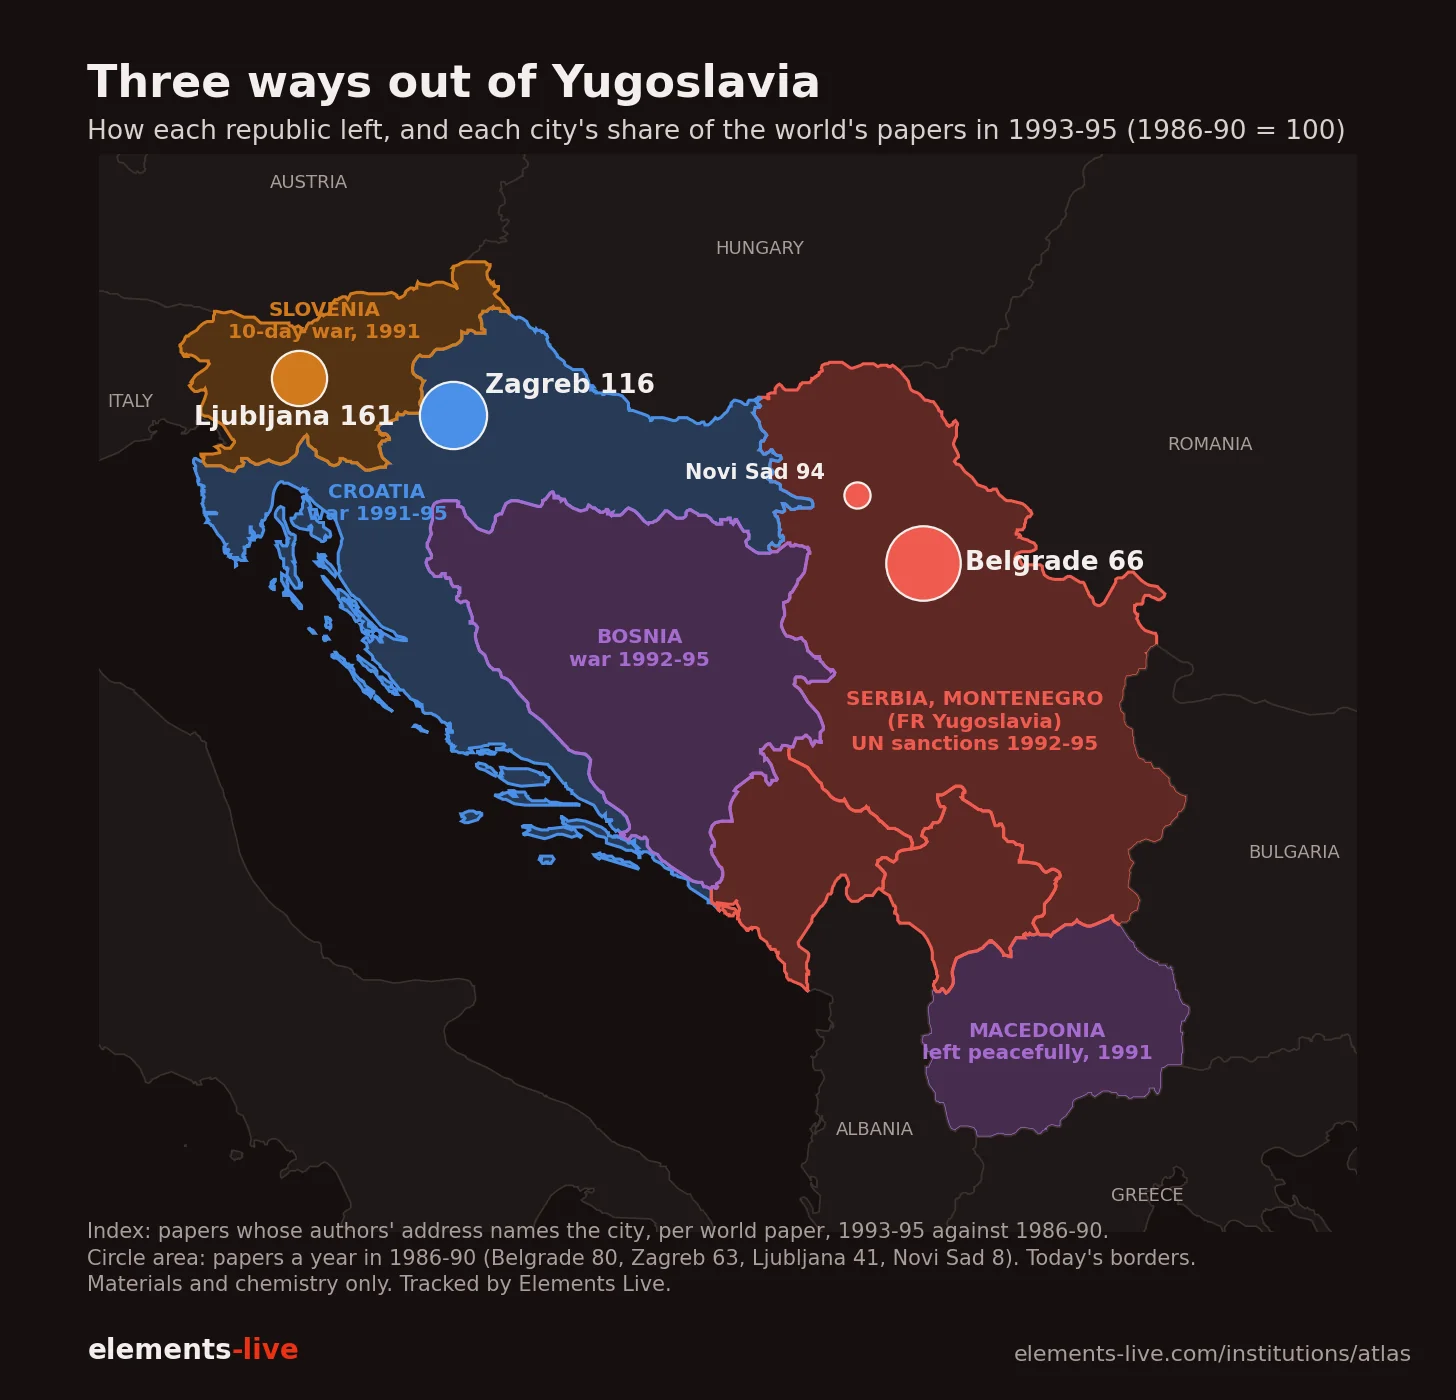
If the war had done the damage, Zagreb should have suffered most, and yet, counting papers by the city in the authors' addresses and comparing each city's share of the world's papers with its share in 1986–90, Ljubljana rose to 161 in 1993–95, Zagreb held at 116, and Belgrade fell to 66. Belgrade's own count went from 82–99 papers a year in 1989–92 to between 52 and 68 a year during the sanctions, and it didn't get back above 90 until 1999.
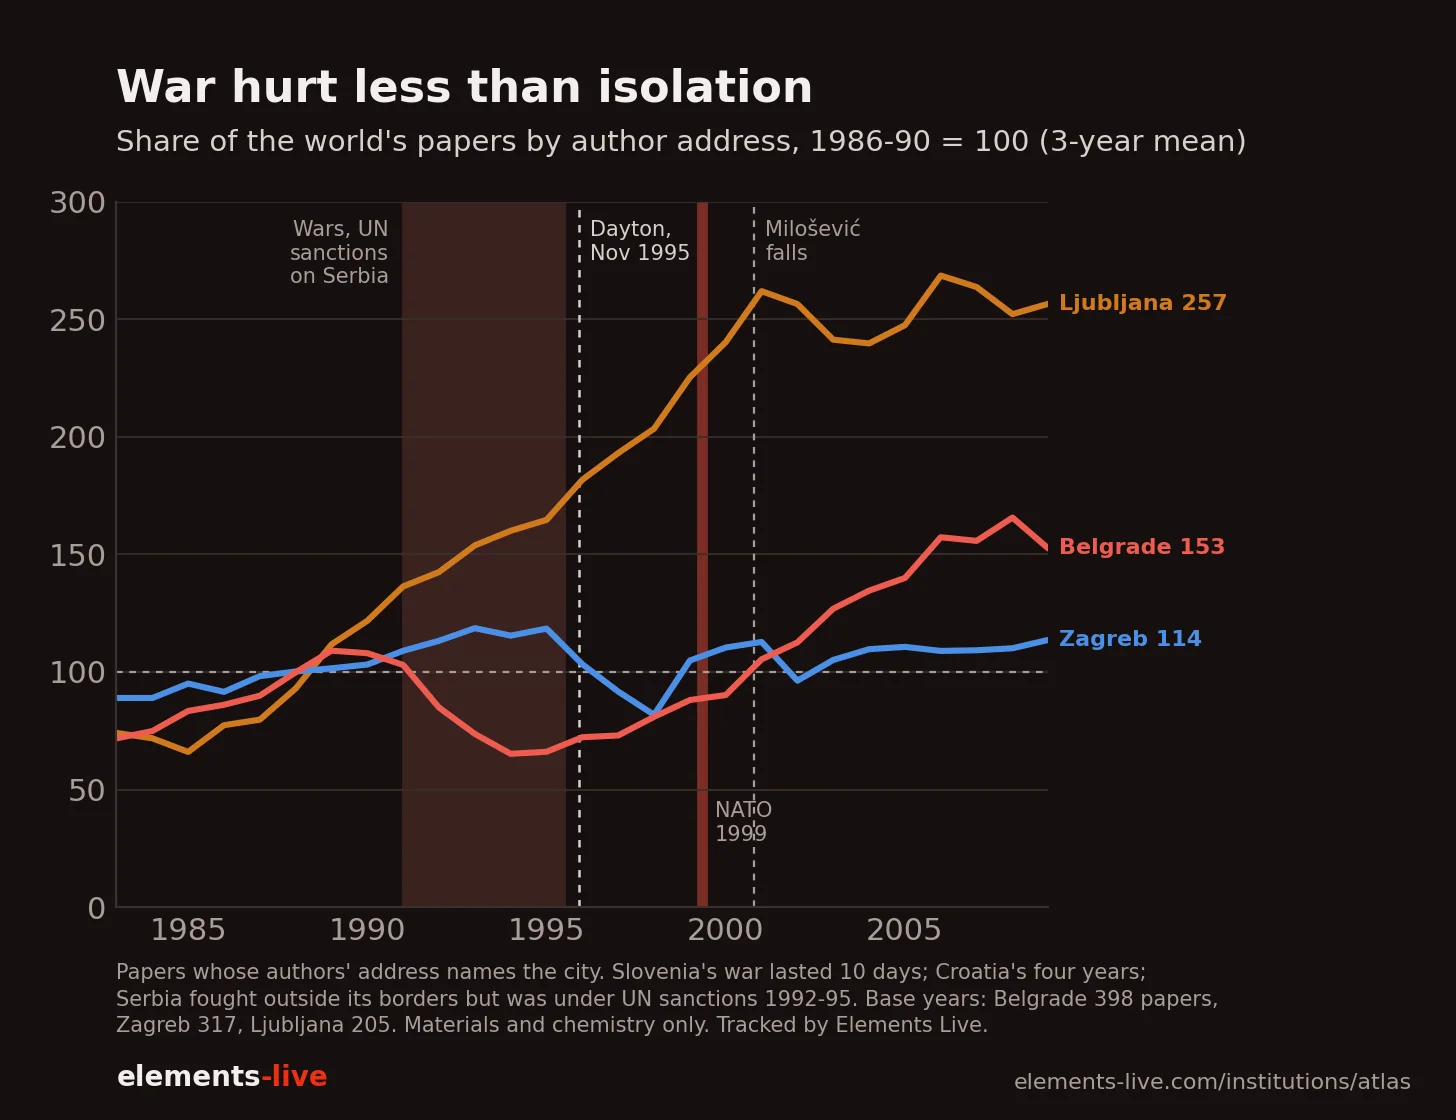
The fall wasn't mainly a loss of foreign partners. The share of Belgrade's papers with a co-author outside the former Yugoslavia thinned from 39% to 31% over the decade, but it never collapsed; what fell was how much Belgrade wrote at all. My reading is that sanctions and hyperinflation emptied the labs of what papers are made of, from reagents and instruments to journal subscriptions, conference travel and salaries worth living on, and that, measured in papers, this cost Belgrade's science more than four years of war cost Zagreb's. Zagreb's own dip came after the fighting, in 1996–98, and settled back within a few years.
The city that left peacefully gained the most, since Ljubljana was already rising in the late 1980s, kept rising straight through Slovenia's ten-day war and the break-up, and by the early 2000s had more than doubled its share.
Who Left, and Who Came Back
Papers are one proxy and people are another, so I followed the 686 researchers who wrote at least two materials or chemistry papers from a Yugoslav address before 1992 through the rest of their careers, in every field they later published in, and ran the same test on Austrian and Hungarian researchers as a baseline. About one in five of those from Serbia and one in six from Croatia published only from abroad at some point after 1991, and roughly two-thirds of them later appear on papers from home again. That sounds like a brain drain until you see the baseline: a quarter of Austrian and Hungarian researchers did the same, because spending years abroad is simply what research careers look like. The share who stopped publishing altogether by 1995 was the same 15% in Serbia, Croatia, Austria and Hungary, and those who stopped mostly did so at home rather than after leaving.
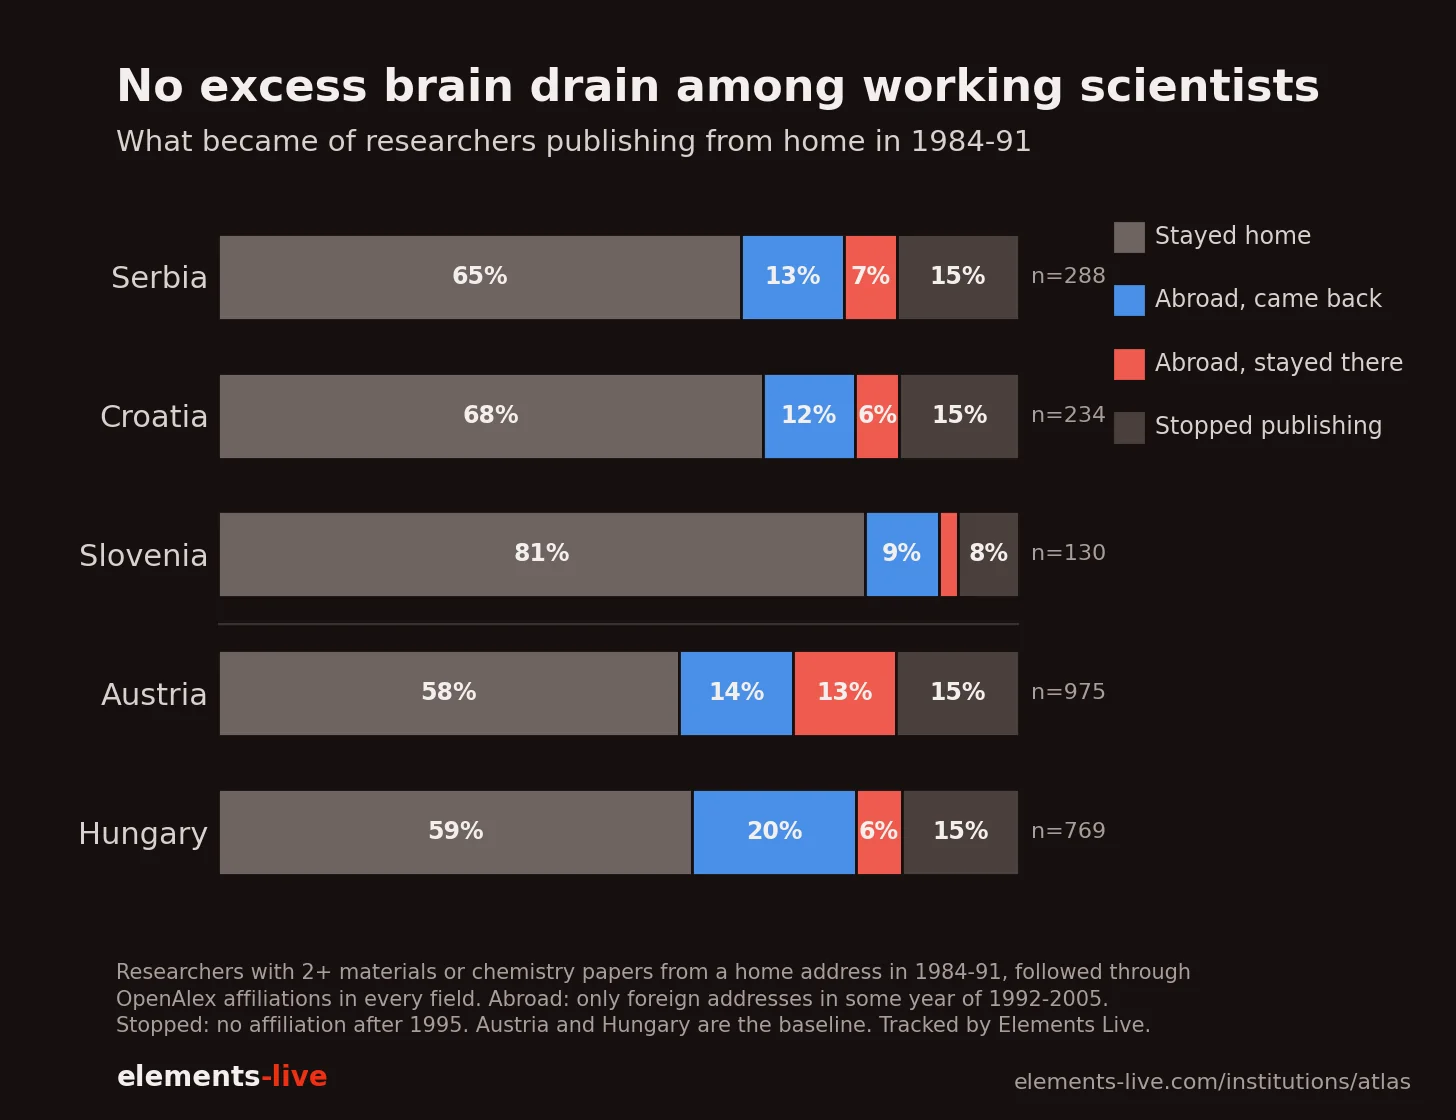
So among scientists who were already publishing, the former Yugoslavia lost no more people than its neighbours did, which says something about the collapse in Belgrade's output. Croatia lost about as many researchers as Serbia, yet Zagreb kept writing while Belgrade lost a third of its papers, and neither lost more than Vienna. The people weren't the main loss; the researchers who stayed in Belgrade were the ones cut off. The brain drain people remember from the 1990s was largely of students and young graduates who left before they ever published, and that is one thing a paper trail can't see.
It has two more blind spots, because it can't see an offer abroad that was withdrawn before anyone moved, and it can't tell a scientist who stopped publishing from one who went abroad into industry, where papers are rare.
Dayton, Then October 2000
The first turn came with the Dayton agreement, initialled in November 1995, which ended the war in Bosnia and suspended the UN sanctions on Serbia, and the bottom of the whole series sits just before it. Serbia's share of the world's papers fell to 0.77 per mille in 1993 and stayed there through 1995, then climbed by about a third to roughly 1.0 by 1997, while Belgrade went from 52 papers a year at the worst back to around 80. Ljubljana's rise steepened in the same years, and Croatia was the one that moved the other way, with its dip in 1997–98, after its own war had ended.
Dayton lifted the sanctions but not the isolation. An outer wall of restrictions kept Serbia out of most international institutions, and in the spring of 1999 the war in Kosovo brought NATO's air campaign against Yugoslavia, from March to June. The campaign doesn't show in that year's papers, which were mostly written before it began, but it does a year or two later, when, counting single years rather than the smoothed curves, Serbia's share slipped from 1.3 per mille in 2000 to 1.0 in 2001 and Belgrade's count from 101 papers to 85, before both jumped to new highs in 2002. That trough mixes the campaign's delayed cost with the first months after the change of government, so the data can't say how much of it belongs to each. The change came in October 2000, when Slobodan Milošević fell to a movement whose core, Otpor, had been founded by Belgrade students two years earlier. What happened next is the second and larger turn, and the clearest signal in the whole series. Serbia's share of the world's papers rose from about 1.0 per mille to 2.4 by 2007, passing both Croatia and Slovenia, and kept climbing to about 2.5 by 2013. Nothing in the data before or since moves that fast.
The specialities moved along with the shares, and by the 2000s Serbia's electrochemistry had dropped out of its top three fields and Slovenia had made ferroelectric ceramics its signature, at the Jožef Stefan Institute, while Croatia kept heavy-metal toxicology first. Since 2014 the three have converged, with toxicology at or near the top in all of them and dental and bone materials appearing in each, so the countries that broke apart now do more of the same science than they did when they were one country.
People, Not Politics
A country's papers tend to follow its researchers rather than its population, as China's rise showed, and the successor states put that to a hard test, because their populations have been shrinking since the 1990s, by about 13% in Serbia and 16% in Croatia, while their research workforces grew. Per head of population they look very different from one another, with Slovenia writing three and a half times the rate of the big producers and Serbia and Croatia closer to theirs. Per researcher the gap almost disappears, and all three converge on 1.1 to 1.4 times the big producers' rate, the same band as Czechia and Poland. Slovenia isn't more productive per scientist; it simply has more scientists for its size.
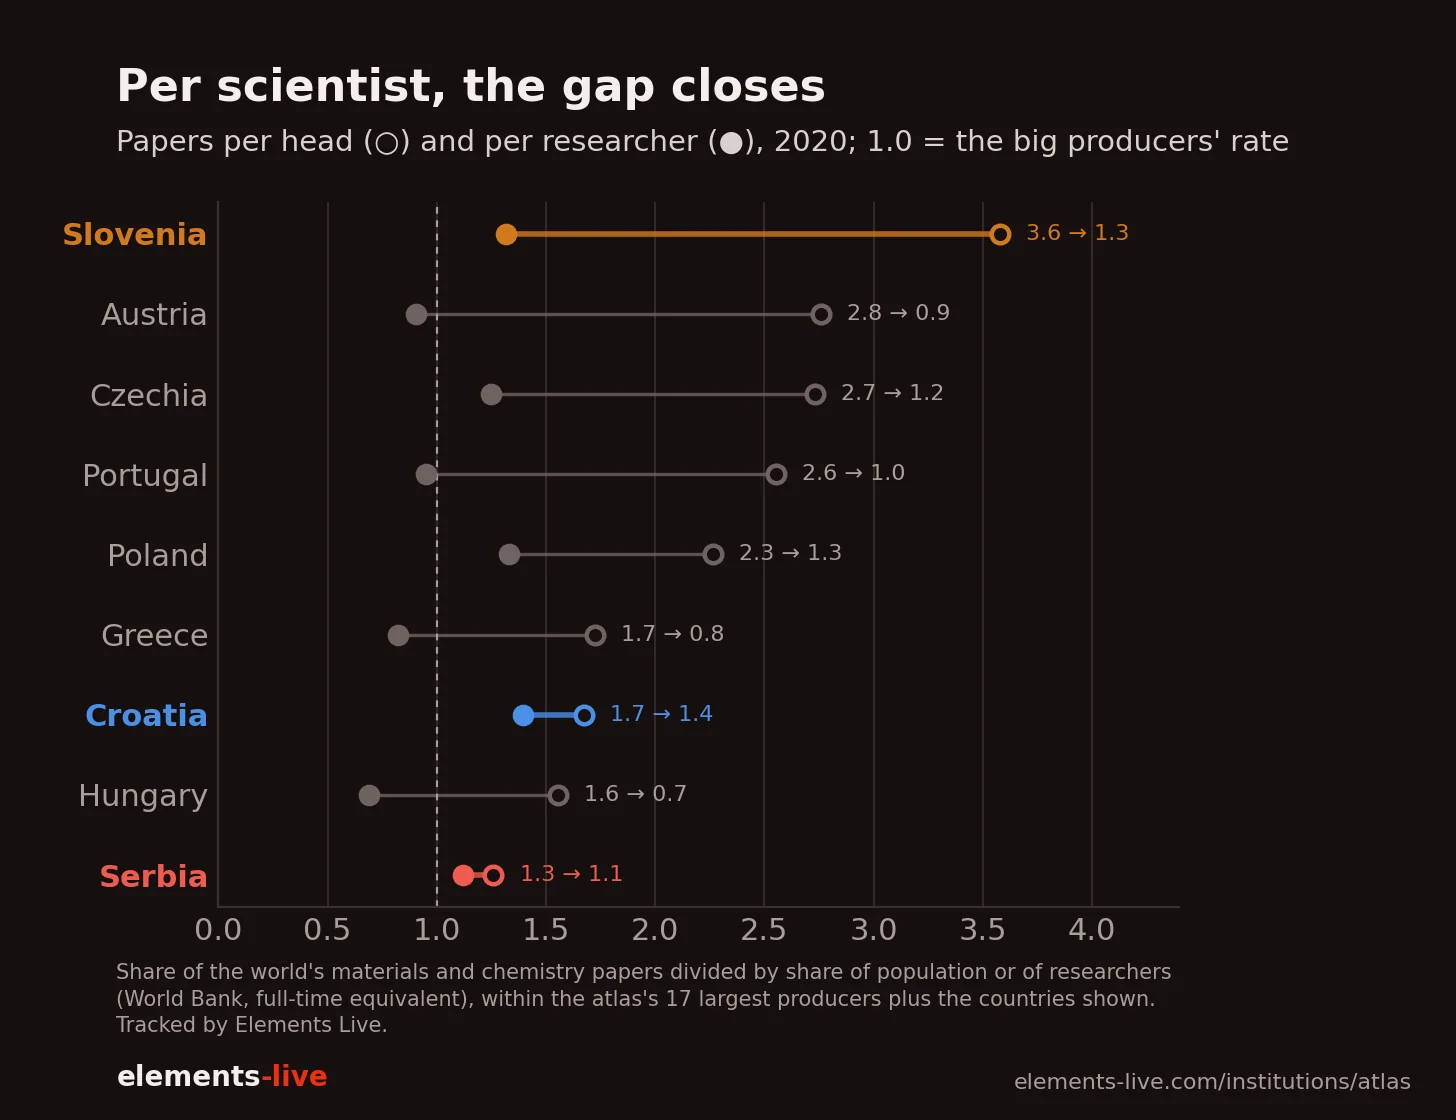
Impact tells a less comfortable story for Serbia. Measured as research impact per researcher, Serbia fell from 1.22 times the big producers' rate in 2005 to 0.88 in 2020, so it still writes more papers per researcher than they do, but those papers carry less weight than they used to. Slovenia's work sits at the world average per paper; Serbia's has slipped to about 0.8.
The lever is the same one behind China's rise, though Slovenia pulled it in an unexpected place. For every 100 university students, Serbia has about six researchers and Croatia five and a half, which is China's range, while Slovenia went from about five in 2000 to fourteen in 2020, Germany's level, helped at the end by its student numbers falling by a third after 2010. Almost all of Slovenia's new researchers work in companies. Its university and government researchers barely changed between 2008 and 2022, from about 4,000 to 4,600, while its business researchers more than doubled, from about 3,100 to 6,600, on the back of R&D spending that peaked at 2.6% of GDP in 2013 with generous tax relief for firms that did research. Serbia's universities employ more researchers than Slovenia's entire system, about 10,800, but its companies employ about 1,700.
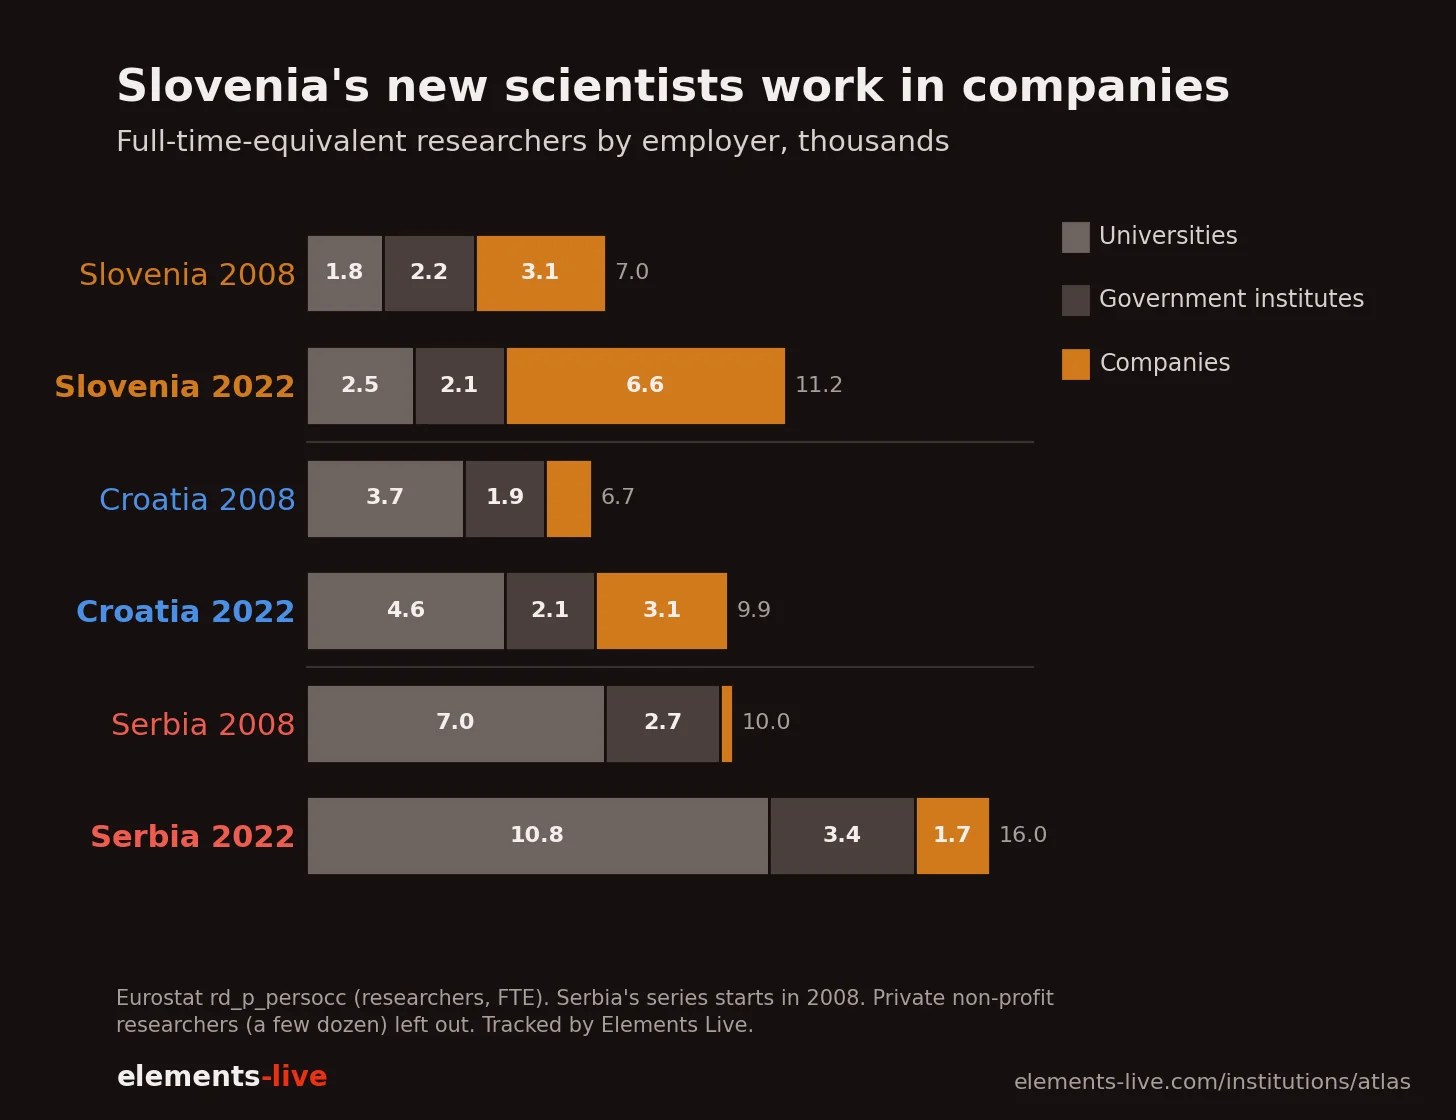
Serbia doesn't lack scientists in its universities; it lacks employers for them outside, and that is where Slovenia's growth came from. With cohorts shrinking, Serbia's science won't grow from more students; it can grow from giving the researchers it trains somewhere to work after the doctorate, and from keeping them.
Since 2013, and the Blockades
Almost every small country's share has fallen since 2013 as China grew, and Serbia is no exception at 1.6 per mille today, alongside Poland and Czechia falling for the same reason. The exception is Croatia, which joined the European Union in July 2013 and has gained share since, from about 1.15 per mille to 1.3, while the number of researchers working in its companies tripled after 2015. It is the one clear membership effect in the data, since Slovenia's share barely moved when it joined in 2004, and neither did those of the countries that joined alongside it. Membership isn't necessarily a cure-all, though, because Croatia's added papers carry less weight each, about 0.8 of the world average per paper against 0.9 before it joined, and Serbia, outside the Union, grew faster between 2001 and 2013 than either member did.
The 2024–25 faculty blockades don't show in the papers yet: the University of Belgrade wrote 732 papers in 2024 and 864 in 2025 on the data so far. Papers trail the lab work behind them by one or two years, so 2026 and 2027 are the years that will show what a year without lectures did.
What the Papers Say
The papers can't tell anyone how to vote or who should govern, and I don't intend this as a side in Serbian politics. What they do say is consistent across forty years. Advancing science is something of a calling, and given the means, people will keep moving it forward even through the perils of war, whereas sanctions take the means away, and no amount of dedication replaces the reagents, instruments and journals a lab runs on. The city that went through four years of war kept writing, the city that was shut out of the world lost a third of its output, and the fastest growth in the whole record came in the years right after the doors opened again.
Whatever the new government does about its universities, the most valuable thing on that record is the one it inherits for free, which is a research community that is already connected to the rest of the world and only needs to stay that way.
Methodology
- Scope: the materials and chemistry research Elements Live tracks, not all of science, and mostly journals indexed in the West, so domestic-language journals are undercounted.
- Country shares: fractional credit by the institution's present-day country, so a 1965 Belgrade paper counts as Serbia.
- Cities: papers whose OpenAlex raw affiliation string names the city, divided by all papers with affiliation strings that year, 1986–90 = 100. Counting by address avoids institution matching, which improved for Slovenian and Croatian addresses after 1991 and would otherwise overstate their rise.
- Small numbers: tens of papers a year per city in the 1990s, so the text quotes multi-year periods rather than single years.
- Impact: our research impact score (RIS magnitude with its time decay), compared only against papers from the same publication year, so the decay cancels. Not field-normalized.
- Per head and per researcher: World Bank population, researchers per million and tertiary enrolment. Per-researcher figures compare against the atlas's 17 largest producers plus the countries named, from 2000.
- Researchers by sector: Eurostat rd_p_persocc, full-time equivalents by employer (business, government, higher education), 2008–2022.
- Fields: research communities from today's citation graph, rolled up to the site's 139 fields; an old paper wears today's field name.
Now What?
The atlas shows every country and institution here year by year. Explore the Atlas
If you were in one of these labs in the 1990s and the numbers don't match what you saw, tell me where. Those comments make the next version better.